Skip to content
WorldNerve
All Sample Reports

Infrastructure · Interactive Sample

Infrastructure Corridor Screening

A 74.9 km illustrative corridor divided into repeatable segments, with a chainage profile and a ranked inspection register.

Built for infrastructure owners, operators, engineers, and maintenance teams.

8 pages · PDF · 2.2 MBReal measurements · Illustrative alignment
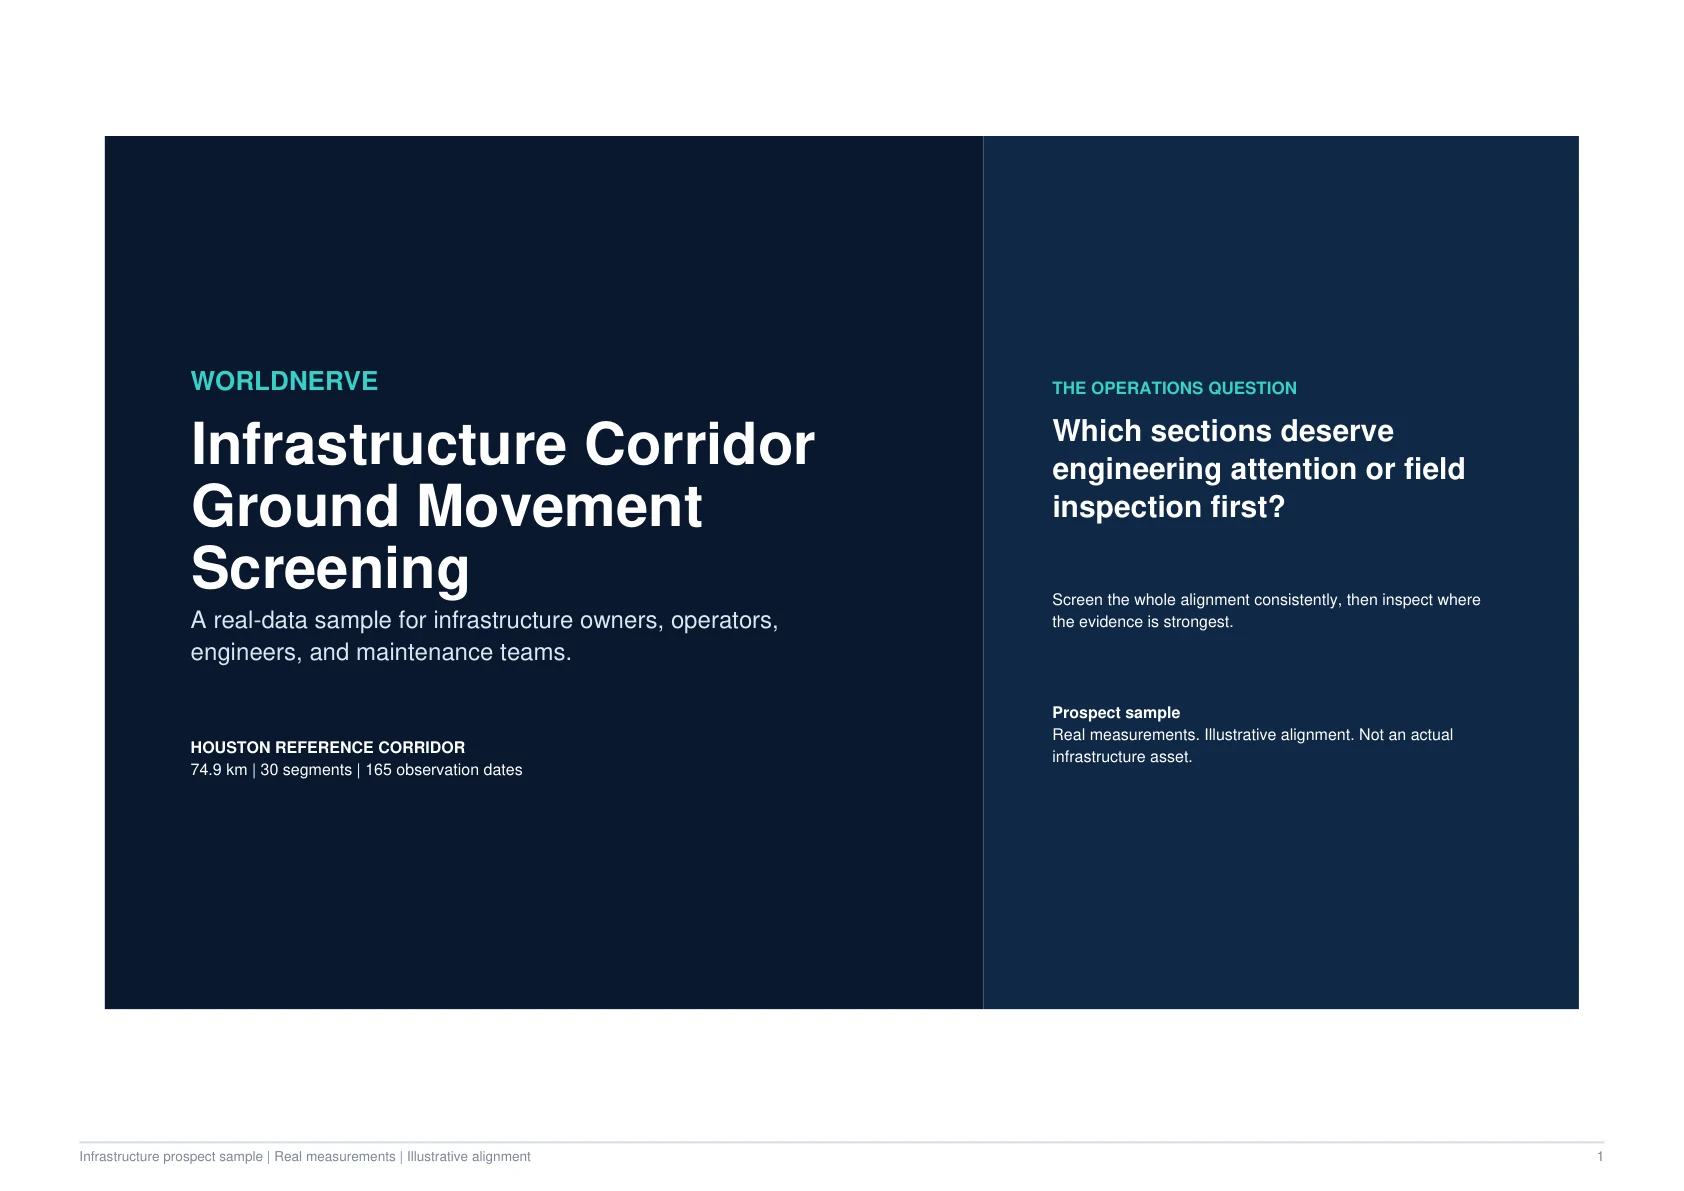
Cover of the WorldNerve Infrastructure Corridor Ground Movement Screening sample
Full evidence pack available as a PDF download

Decision Question

Which corridor segments should move first into inspection or engineering review?

Sample Finding

The 74.9 km sample corridor produces 1 priority-inspection segment and 5 engineering-review segments.

Only 57% of the illustrative corridor had sufficient measurement coverage, so evidence gaps remain part of the decision record.

74.9 km
Corridor Length

Illustrative alignment

30
Segments

Repeatable screening units

1
Priority Inspection

SEG-030

57%
Measurement Coverage

Coverage is not uniform

Interactive Evidence View

Segment Review Register

The register ranks measured segments while keeping the corridor's incomplete coverage visible.

Priority Inspection
1
Engineering Review
5
Other Screened Segments
24

This code-native view highlights selected report findings. Download the PDF for the complete maps, time series, methodology, confidence notes, and evidence tables.

Inside the Report

Follow the Evidence From Question to Action

The online experience explains the decision logic in a scannable format. The downloadable report preserves the full technical evidence record.

01

A Repeatable Corridor Framework

The alignment is divided into consistent chainage segments so movement indicators, confidence, and actions can be compared along the route.

  • Every segment retains a stable identifier.
  • Chainage makes findings usable by inspection teams.
  • The same framework can support future monitoring updates.
02

Priority Segment Evidence

SEG-030 is highlighted for priority inspection with a measured trend of -8.9 mm/year and 51% coverage in the sample.

  • The flagged result includes its measurement support.
  • Coverage limits remain visible beside the rate.
  • The report directs attention without declaring a defect.
03

Coverage-Aware Planning

The corridor view distinguishes segments with useful evidence from areas where satellite measurement support is limited or absent.

  • Evidence gaps are not silently treated as routine results.
  • Other survey methods can target low-coverage sections.
  • GIS-ready outputs connect the screening to asset systems.

Responsible Interpretation

What This Evidence Does Not Decide

The report is designed to make its boundaries as visible as its findings.

  • Only 57% of the illustrative corridor had sufficient measurement coverage.
  • A measured trend does not establish asset condition or defect.
  • Low or absent coverage is not evidence of stability.
  • Inspection and engineering teams remain responsible for asset decisions.

Next Steps

Turn the Finding Into a Proportionate Workflow

  1. 1

    Inspect SEG-030 and review the 5 engineering-review segments.

  2. 2

    Compare the register with maintenance, survey, and incident records.

  3. 3

    Use complementary methods where satellite coverage is insufficient.

Start a conversation

See What the Satellite Archive Can Support for Your Location

Start with an address, coordinate, boundary, corridor, or location list. WorldNerve will review feasibility before proposing a larger scope.