9-Page Real-Data Portfolio Sample
See How 30 Locations Become a Decision Queue
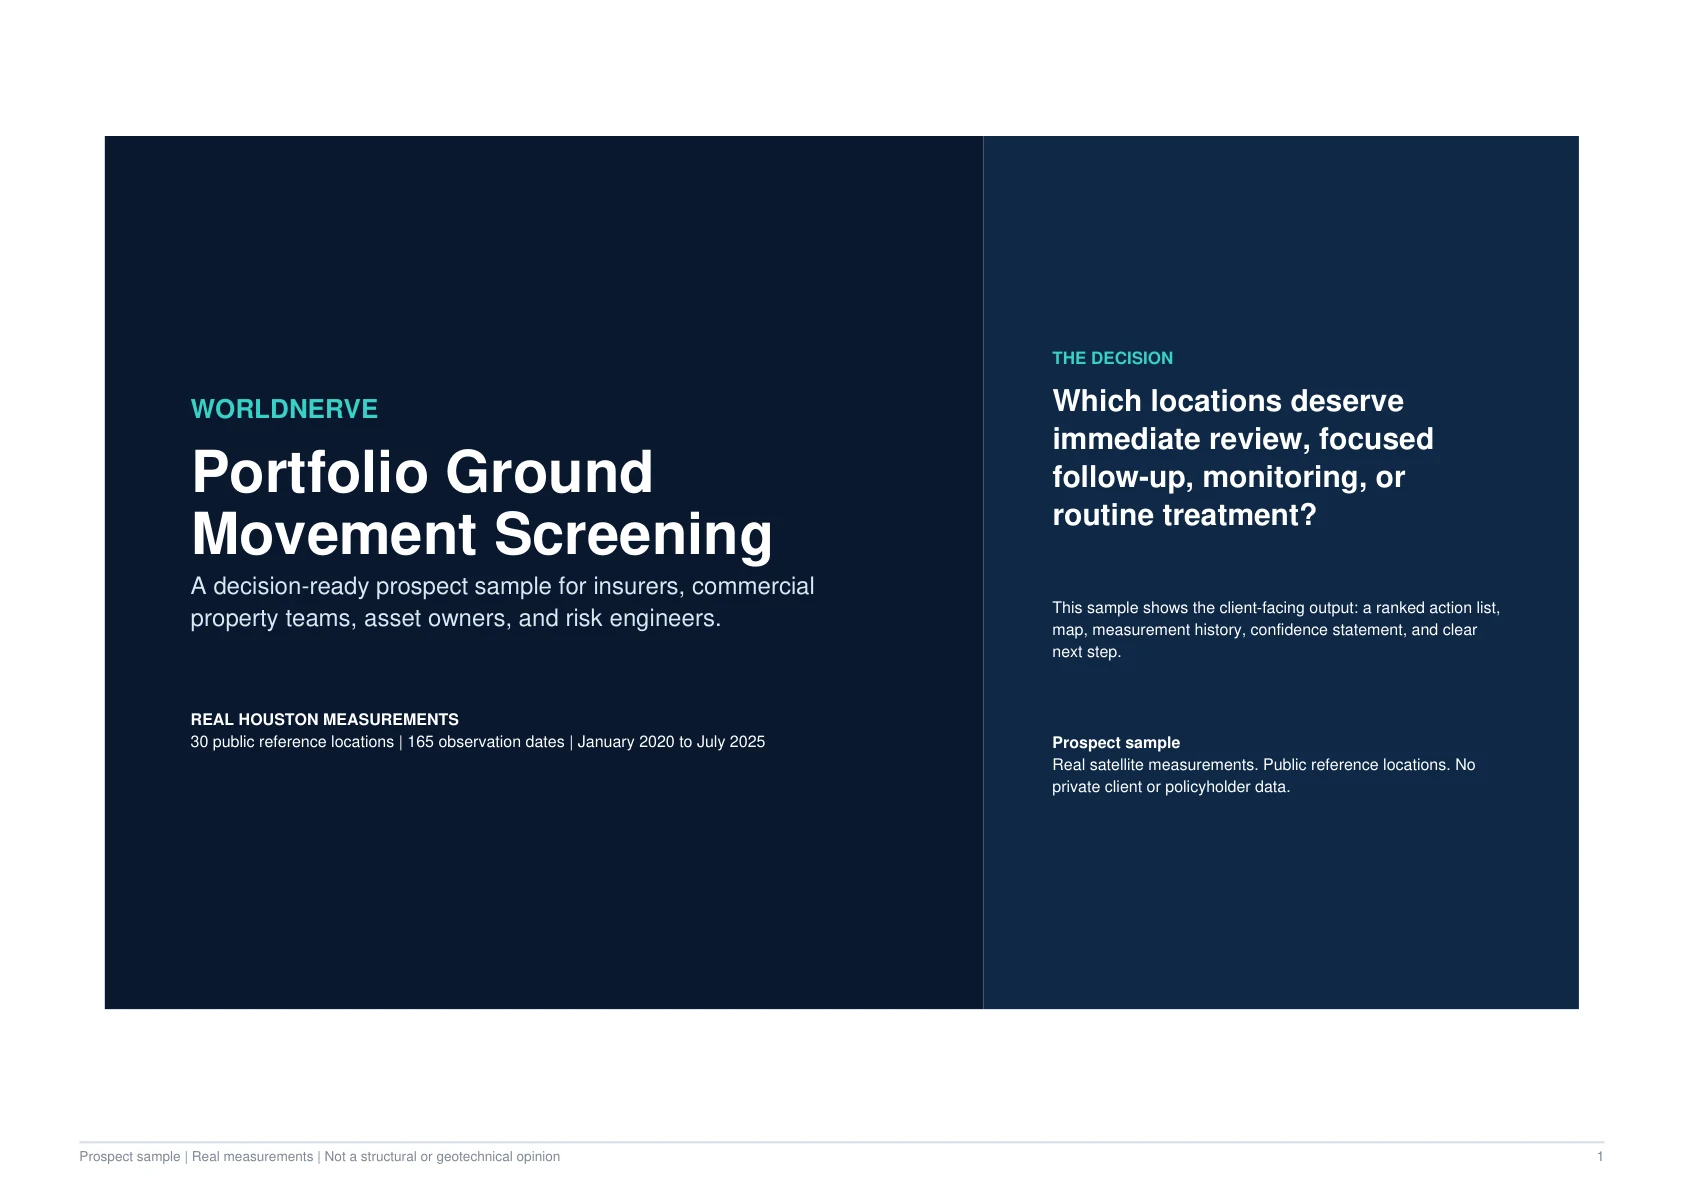
Read a complete example of how WorldNerve turns real satellite measurements into a ranked portfolio screening result.
Inspect the action register, portfolio map, referred and routine location histories, confidence language, limitations, and client-ready outputs.
Real-data prospect sample. The measurements come from a real Houston satellite archive. Public reference locations demonstrate the format; no private client, insured, claim, or policyholder data is included.
Need a claims, property, infrastructure, municipal, insurance, or monitoring example? Compare all 8 sample reports.
Inside the report
A Complete Real-Data Example
The sample shows how technical measurements become a report that portfolio decision-makers can use and expert reviewers can examine.
What You Can Inspect
Referral Logic, Evidence, Confidence, and Action—in One Document
Movement Map
Time Series
Confidence Notes
Next Steps
- 01How 30 public reference locations become one ranked action list.
- 02How immediate review, focused review, monitoring, and routine outcomes differ.
- 03How geographic concentrations and outliers are shown on one portfolio map.
- 04How the evidence behind a referred location is presented and explained.
- 05How the same process documents a routine location without overstating certainty.
- 06How confidence, measurement geometry, and referral logic are documented.
- 07How machine-readable outputs and proportionate next steps enter a client workflow.
Clear boundaries
What the analysis cannot determine on its own
Satellite-derived ground movement evidence adds a dated, spatial evidence layer. It does not replace the responsible professional’s assessment.
- Structural damage or building safety
- The definitive cause of movement
- Future loss amounts
- Insurance pricing or policy terms
- Claim liability
- Geotechnical or structural condition
A low-risk starting point
Check feasibility before commissioning full analysis
Not every location can be analysed successfully. Measurement quality depends on coverage, surface characteristics, viewing geometry, acquisition continuity, and the question being asked.
- 01 / Define
Share the Location & Question
Send an address, coordinates, boundary, corridor, or small location list and explain the decision you need to support.
- 02 / Check
Review the Available Archive
We review satellite coverage, acquisition continuity, surface suitability, viewing geometry, and likely measurement density.
- 03 / Scope
Receive an Honest Feasibility View
You learn what the satellite record may support before a larger processing scope is proposed.
Start with one location
Request a Data Availability Review
Submit one address, site boundary, corridor, or small location list. WorldNerve will review the available satellite archive and expected measurement conditions before proposing a full scope.